A Clearer View of the Market

Tick the Signal. Trade Smart.

The Platform

Chart – Analyse – Review.
All From One Platform

Illustrative reference video, pending replacement with product footage. Execution, order flow and DOM scenes do not represent currently available features.

Illustrative media preview
DOM
OrderflowIllustrative reference video — not a demonstration of currently available features
ChartsIllustrative reference video — not a demonstration of currently available features
TradeIllustrative reference video — not a demonstration of currently available features
DOMIllustrative reference video — not a demonstration of currently available features
AnalysisIllustrative reference video — not a demonstration of currently available features
Chart Workspaces
Multi-pane Layouts
Technical Indicators
Watchlists
Script Editor
Features

Read price.
Add context.
Review signals.

Explore charts, indicators, drawings, watchlists and scripts in SignalTick. Images shown here are illustrative references pending replacement.

Explore all features
01

Chart Workspaces

View markets in chart panes and adjust the workspace to suit your analysis.

  • Candlestick charts
  • Multi-pane layouts
  • Chart settings
  • Price and time navigation
02

Technical Indicators

Add built-in indicators and configure their inputs in the chart workspace.

  • Trend and momentum
  • Volume studies
  • Overlay indicators
  • Sub-pane indicators
03

Drawing Tools

Mark levels and patterns while reviewing a chart.

  • Trend lines
  • Horizontal levels
  • Fibonacci tools
  • Drawing settings
04

Watchlists and Signals

Organize symbols and inspect chart signals. Server scans and scan email depend on configuration.

  • Watchlists
  • Chart signals
  • Scan requests
  • Scan results
05

Script Editor

Write and edit custom formulas using the documented scripting language.
  • Formula editing
  • Input parameters
  • Custom indicators
  • Script manual
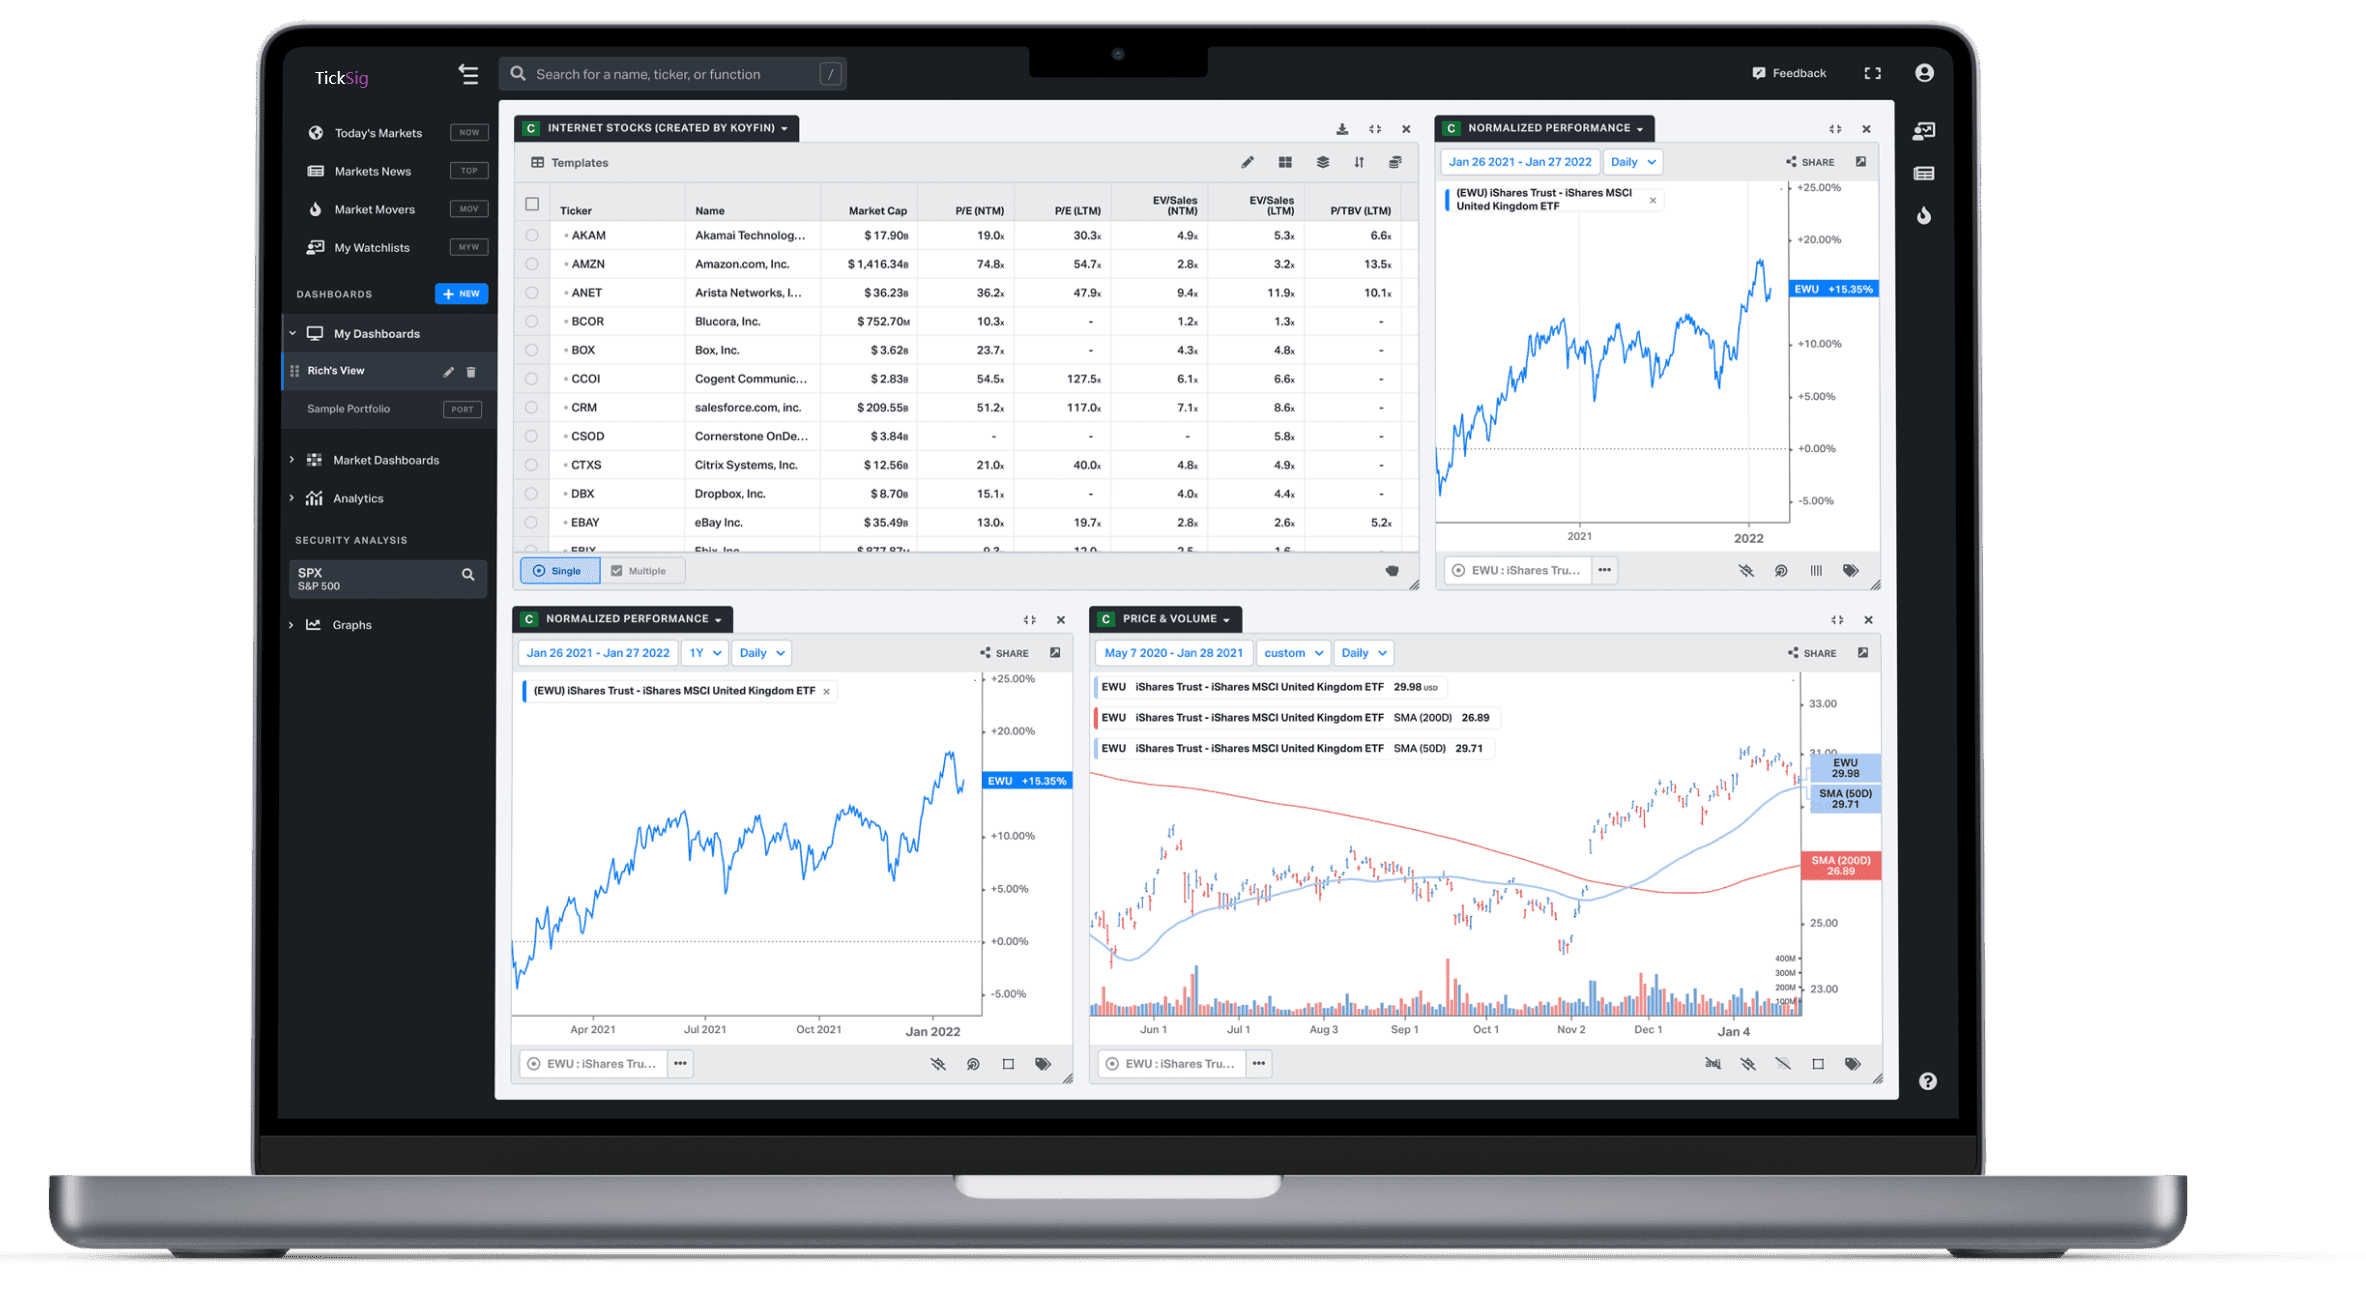
Illustrative financial dashboard referenceIllustrative financial dashboard referenceIllustrative financial dashboard referenceIllustrative financial dashboard referenceIllustrative financial dashboard reference
Chart WorkspacesIllustrative image — product visuals pending replacement01  /  05
Core Capabilities

Tools for Your Chart Workflow

Explore the charting and analysis tools currently implemented in the workspace.

Chart Workspaces

View markets in chart panes and adjust the workspace to suit your analysis.

  • Candlestick charts
  • Multi-pane layouts
  • Chart settings
  • Price and time navigation

Market Data

Load chart data through the configured market data providers. Coverage and update frequency vary by deployment.

  • Tiingo integration
  • Twelve Data integration
  • Symbol search
  • Historical bars

Technical Indicators

Add built-in indicators and configure their inputs in the chart workspace.

  • Trend and momentum
  • Volume studies
  • Overlay indicators
  • Sub-pane indicators

Drawing Tools

Mark levels and patterns while reviewing a chart.

  • Trend lines
  • Horizontal levels
  • Fibonacci tools
  • Drawing settings

Watchlists and Signals

Organize symbols and inspect chart signals. Server scans and scan email depend on configuration.

  • Watchlists
  • Chart signals
  • Scan requests
  • Scan results

Script Editor

Write and edit custom formulas using the documented scripting language.

  • Formula editing
  • Input parameters
  • Custom indicators
  • Script manual
Indicator Library

Explore Built-in Indicators

A selection from the current indicator registry. Inputs, placement and data availability vary by indicator.

Moving Averages

Overlay

Moving averages help describe price direction.

    Chart indicator: MA

    MACD

    Panel

    Compare moving averages through the MACD lines and histogram.

      Chart indicator: MACD

      DMI

      Panel

      Review directional movement and trend strength.

        Chart indicator: DMI

        RSI

        Oscillator

        Review relative strength across a lookback period.

          Chart indicator: RSI

          KDJ

          Oscillator

          Compare price with its recent trading range.

            Chart indicator: KDJ

            CCI

            Oscillator

            Measure price deviation from its statistical average.

              Chart indicator: CCI

              Bollinger Bands

              Overlay

              Review a moving average with standard deviation bands.

                Chart indicator: BOLL

                ATR

                Panel

                Measure the average true range of price bars.

                  Chart indicator: ATR

                  BBI Bollinger Bands

                  Overlay

                  Review volatility bands around a composite moving average.

                    Chart indicator: BBIBOLL

                    OBV

                    Panel

                    Track accumulated signed volume.

                      Chart indicator: OBV

                      Volume

                      Panel

                      Inspect reported volume for each bar.

                        Chart indicator: VOL

                        MFI

                        Panel

                        Compare price and volume through the money flow index.

                          Chart indicator: MFI
                          Why SignalTick

                          Understand the Current Scope

                          A capability comparison, not a performance benchmark. TradingView features depend on its product and plan.

                          CapabilitySignalTickTradingView
                          WorkspaceMulti-pane charts with tier limitsMulti-chart layouts with synchronization
                          Drawing toolsChart annotations and drawing settingsDrawing tools with layout and global synchronization
                          PerformanceNo published benchmarkNot benchmarked in this review

                          TradingView sources: chart synchronization and drawing tools. Reviewed September 13, 2026.

                          Pricing

                          Simple, Transparent Pricing

                          Find the right workspace for your analysis.

                          MonthlyAnnual Save 20%
                          Free
                          For exploring charts and following your markets.
                          $0/mo
                          Free tier
                          View Availability
                          • ✓1 Chart Pane per Workspace
                          • ✓1 Sub-pane Indicator per Chart
                          • ✓Built-in Indicator Library
                          • ✓Chart Drawing Tools
                          • ✓Watchlists
                          • ✓Chart Settings
                          • ✓Formula Script Editor
                          • ✓Script Manual
                          Plus
                          For comparing two charts in one workspace.
                          $49/mo
                          Billed monthly
                          Subscribe
                          • ✓2 Chart Panes per Workspace
                          • ✓2 Sub-pane Indicators per Chart
                          • ✓Built-in Indicator Library
                          • ✓Chart Drawing Tools
                          • ✓Watchlists
                          • ✓Chart Settings
                          • ✓Formula Script Editor
                          • ✓Script Manual
                          Ultra
                          For power users building larger chart layouts.
                          $249/mo
                          Billed monthly
                          Subscribe
                          • ✓9 Chart Panes per Workspace
                          • ✓8 Sub-pane Indicators per Chart
                          • ✓Built-in Indicator Library
                          • ✓Chart Drawing Tools
                          • ✓Watchlists
                          • ✓Chart Settings
                          • ✓Formula Script Editor
                          • ✓Script Manual
                          Enterprise
                          For expanded chart and indicator capacity.
                          $499/mo
                          Billed monthly
                          Subscribe
                          • ✓9 Chart Panes per Workspace
                          • ✓8 Sub-pane Indicators per Chart
                          • ✓Built-in Indicator Library
                          • ✓Chart Drawing Tools
                          • ✓Watchlists
                          • ✓Chart Settings
                          • ✓Formula Script Editor
                          • ✓Script Manual

                          Preview pricing. Subscriptions and free trials are not available yet. View availability before choosing a plan.

                          FAQ

                          Common Questions

                          Self-service registration, trials and checkout are not available yet. The plan overview describes current workspace limits; it does not activate a subscription. Existing users can sign in or open the workspace from the availability page.

                          The tier limits count sub-pane indicators per chart, not the number of indicators in the library. Free, Plus, Pro, Ultra and Enterprise allow 1, 2, 4, 8 and 8 sub-pane indicators respectively.

                          The project integrates Tiingo and Twelve Data. Symbol coverage, history and update frequency depend on the provider and deployment configuration. No exchange-to-screen latency guarantee is offered.

                          SignalTick is a browser-based chart workspace. Native mobile apps and redistributable framework SDKs are not currently offered.

                          The script editor supports the formula language documented in the Script Manual. Do not assume Pine Script or TypeScript source compatibility.

                          In-chart signals and server scan requests are separate workflows. Scan email delivery depends on server configuration. Continuous background monitoring, webhooks and push delivery are not offered as a verified service.

                          Broker order execution, a live DOM ladder and footprint trading are not available as verified product features. The reference video is illustrative.

                          The current images and video are illustrative references pending replacement. Use the feature descriptions and current workspace to assess availability.

                          Public white-label, SSO and uptime guarantees have not been established. Enterprise is currently a workspace tier name, not a promise of those services.

                          Explore Your
                          Chart Workspace

                          Review current availability and read the formula language guide.